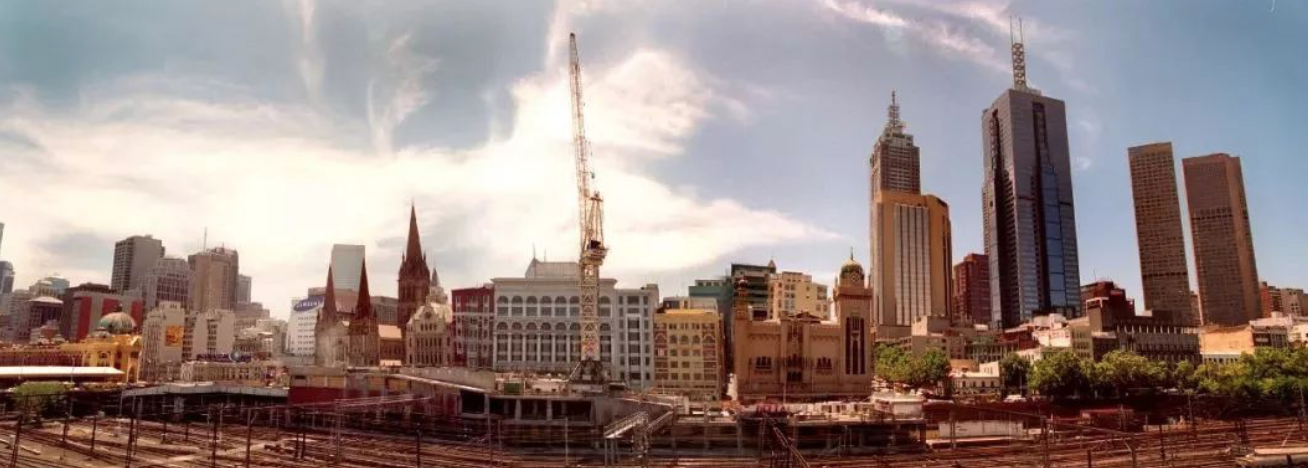
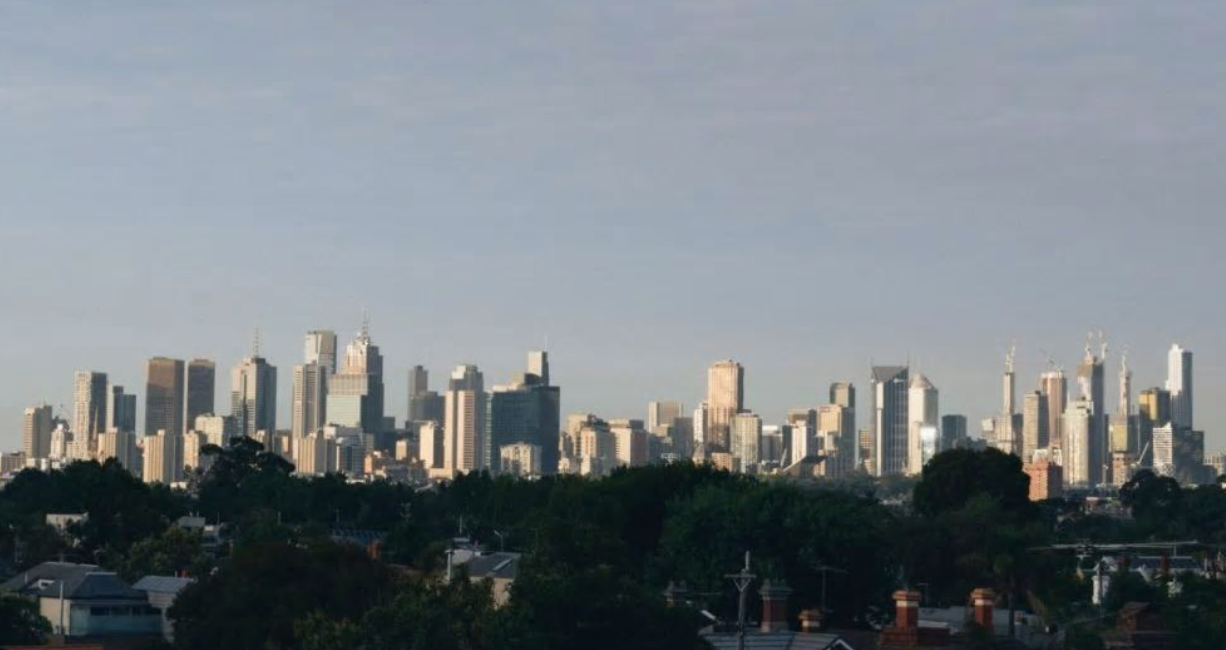
The fastest and slowest urban district in Melbourne sold! With a 20-year price comparison
According to the sales data of the Domain Group, in the 10 cities with the fastest real estate sales on the market last year, the median price of houses in seven urban areas was below A$600,000.
Which area is best or hard to sell?
Melbourne’s fastest selling real estate is located on the edge of the city
HOUSE sells the fastest city list
Suburban time to market median price
Rowville 22 $856,500
Frankston North 23 $470,000
Carrum Downs 24 $525,000
Cranbourne West 24 $511,000
Ferntree Gully 24 $740,000
Hampton Park 24 $500,000
Langwarrin 25 $592,500
Cranbourne 26 $500,000
Frankston 26 $590,500
Mooroolbark 26 $720,000
Low-priced homes tend to sell faster. In addition, the policy of stamp duty reduction for first home buyers further promoted the sale of low-priced properties in 2017 and early this year.
HOUSE sells the slowest downtown list
Suburban time to market median price
Werribee South 227 $680,000
Narre Warren North 95 $1,150,000
Toorak 93 $4,395,000
Gisborne 93 $660,000
Broadmeadows 92 $530,000
Dandenong 88 $520,000
Rockbank 86 $557,500
Greenvale 85 $679,000
Maddingley 82 $452,500
Footscray 78 $860,000
The 10 cities with the slowest real estate sales have also been affected by the price. Some urban districts are located on the edge of the Melbourne city, like Werribee South’s slowest No.1. The time to market is 227 days from the sale, mainly because The development of urban areas is immature, and infrastructure facilities cannot keep up with the speed of housing construction.
Which city’s Units is best or hard to sell?
Units sells the fastest city list
Suburban time to market median price
Croydon 27 $510,000
Frankston 34 $362,500
Bentleigh East 40 $605,000
Elwood 42 $645,000
St Kilda East 51 $561,000
Mentone 53 $512,650
Mitcham 53 $602,500
Thornbury 53 $495,000
Meadow Heights 57 $350,000
Brunswick 58 $477,000
Units sells the slowest downtown list
Suburban time to market median price
Maribyrnong 182 $478,000
Bacchus Marsh 171 $295,000
Sunshine 168 $312,500
Abbotsford 162 $525,000
Bundoora 152 $397,500
Docklands 149 $592,500
Travancore 148 $345,000
Southbank 142 $558,444
Clayton South 142 $450,000
Sandringham 140 $681,750
For some cities with high median house prices, real estate is harder to sell because the affordable buyer base is very small. Is the slower the sales, the slower the rise in house prices?
20 years price comparison
According to the statistics of REIV, Melbourne’s urban expansion has extended to 70 kilometers away from the city center. The old housing prices have already gone crazy with strong housing prices.
The ten most affordable urban districts in 1997 and their median prices
The ten most affordable urban districts in 2017 and their median prices
Melton, for example, has had a four-fold increase in housing prices in 20 years due to the small price base.
However, from 1997 to 2007, the number of the ten most expensive urban areas in 20 years was even more striking.
The most expensive ten urban districts in 1997 and their median prices
The median price of the ten most expensive urban areas in 2017 and their prices
Although the four most expensive suburbs did not change in rankings, prices have gone up more than sixfold.
Some people may say that housing prices are rising, but wages and consumption levels will also increase. However, median house prices in Melbourne have increased by 300% in 20 years, while weekly wages have only increased by 121%.
No wonder, the rich are still so rich, ordinary people are hard to surpass! They simply invest in the price of a suite, and they all earn more money than they do in their lifetime.
Leaver a comment